import pandas as pd
import geopandas as gpd
import folium
import seaborn as sns
import matplotlib.pyplot as pltParticulate matter (PM) 2.5 target of 10 μg/m3 within reach for Shoreditch and surrounding districts
By Andrew Sivanesan
Spring 2026
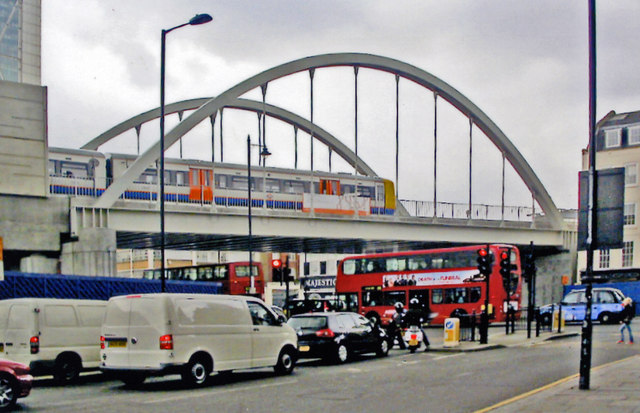
Bridge over Brick Lane at Shoreditch High Street station, 2010.
© Copyright Ben Brooksbank and licensed for reuse under Creative Commons Licence.
Source: Geograph
Executive summary
The London Enviroment Strategy: Fourth Progress Report states that “the Mayor aims for the capital to have the best air quality of any major world city, going beyond the legal requirements to protect human health and minimise inequalities” (Greater London Authority 2024). Therefore, policymakers should consider targeting activities to reduce the annual average concentrations of particulate matter (PM) 2.5 at Shoreditch, Whitechapel, Hoxton, Haggerston and Bethnal Green. See Figure 1 for an interactive map. See Section 3 for step-by-step data analyis.
Analysis of the most recent data from the London Atmospheric Emissions Inventory (LAEI 2022) shows that these five districts have the highest annual average concentrations of particulate matter (PM 2.5) in Tower Hamlets and Hackney - two of the most deprived boroughs in London (Ministry of Housing, Communities & Local Government 2025). While these five districts are achieving the World Health Organisation’s (WHO) third interim target of between 10 and 15 μg/m3 (World Health Organization 2021a), they are within 1 μg/m3 of achieving the fourth interim target of between 5 and 10 μg/m3. For context: the fourth interim target is being achieved by the rest of Tower Hamlets and Hackney. Achieving interim target 3 is an important step towards achieving the World Health Organisation’s Air Quality Guideline of less than 5 μg/m3 of annual average PM 2.5 concentrations, which minimises negative health impacts.
Recommendation
Policymakers may wish to consider a public awareness campaign in the heart of east London reminding local residents of the London Assembly’s recommendations for improving air quality (London Assembly n.d.). Their recommendations are listed below for ease of reference.
- Walk, cycle and scoot more, and avoid the busiest roads and times when you can
- Use public transport where you can, but if you do have to drive, switch your engine off when you’re stationary.
Any air quality improvement activities in these districts would be best done in partnership with community-led initiatives such as Breathe London Communities (Breathe London Communities n.d.) to ensure the activities are relevant to, and have buy-in from, local residents.
Introduction

Protected view of St Paul’s Cathedral from King Henry’s Mound, Richmond Park
Credit: Bartholomeus Thoth. Licensed for reuse under Creative Commons Licence.
Source: Wikimedia Commons
The air we breathe is vital to our health and wellbeing. Londoners can instinctively tell between the crisp, refreshing air they enjoy when strolling through leafy Richmond Park (outer London) versus the stagnant, granular air they inhale when sauntering down bustling Brick Lane (inner London). As the climate crisis deepens there’s increasing focus around the world - including in London - on the climate, social and health impacts of human activity. While carbon dioxide (CO2) is a familiar pollutant in the public consciousness there is a growing focus among policymakers and regulators on particulate matter (PM) emissions: including PM 2.5. This report uses geospatial analysis and visualisation of the latest data available from the London Atmospheric Emissions Inventory (LAEI 2022) to highlight the districts within Tower Hamlets and Hackney where air quality improvement activities are most needed.
What is PM 2.5?
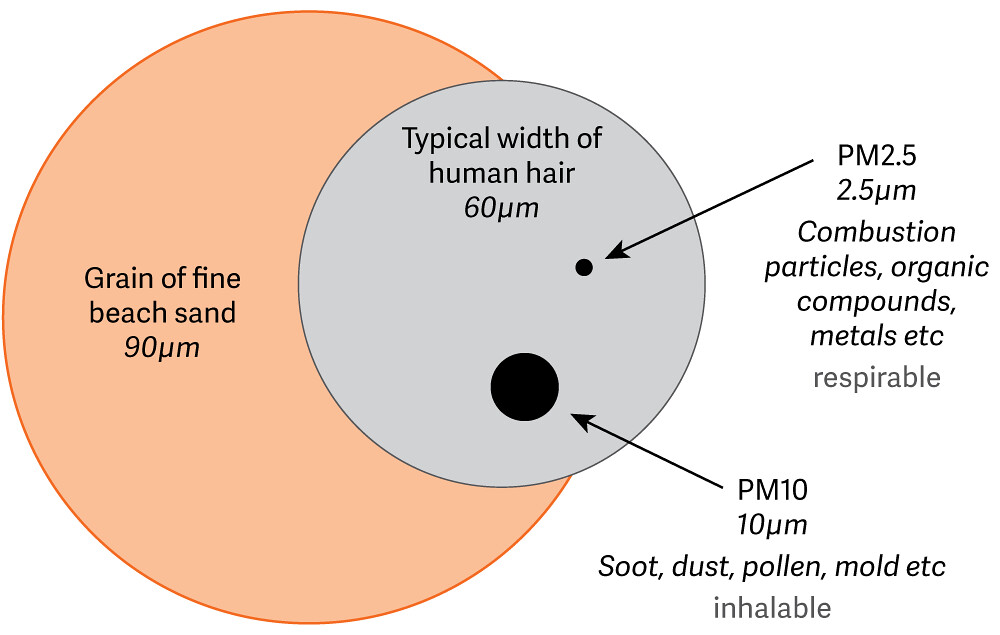
The diameter of PM 2.5 is smaller than a grain of sand and a human hair.
Source: Grid-Arendal (www.grida.no/resources/8282)
PM 2.5 are fine particles with a diameter of 2.5 µm or less. Smaller than a grain of beach sand (90 µm). Smaller than the width of a human hair (60 µm). This means they are small enough to enter the bloodstream and get lodged in major organs such as the heart and brain. Typical sources of PM 2.5 include brake wear and tyre wear from road vehicles. Young children, the elderly and those with respiratory conditions such as asthma are at most risk of illness from PM 2.5 (Department for Environment, Food & Rural Affairs 2025). Therefore, reducing PM 2.5 near schools, hospitals and care homes is a priority.
Concentrations of pollutants including PM 2.5 tend to be higher in built-up inner city areas due to a combination of factors including road traffic congestion - which results in engine idling and repetitive braking - and lack of open space for pollutants to disperse into the surrounding atmosphere.
Why focus on PM 2.5?
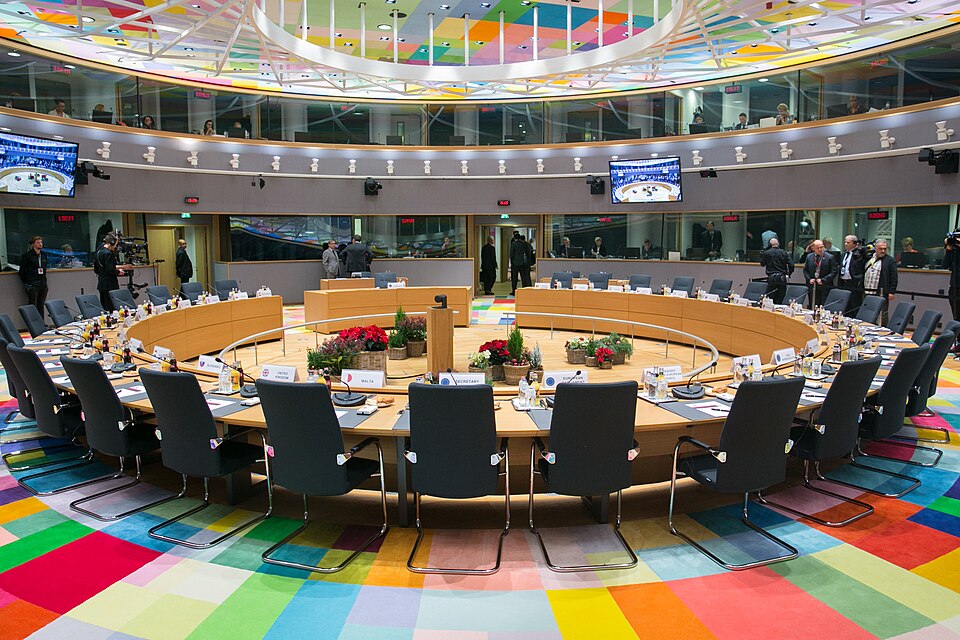
European regulation is one of many reasons for a growing focus on PM 2.5
Credit: EU2017EE Estonian Presidency
Source: Wikimedia Commons
PM 2.5 is coming into sharper focus across health-based international guidelines, transport research and European regulation. The World Health Organization (WHO) have stated that “the burden of disease attributable to air pollution is now estimated to be on a par with other major global health risks such as unhealthy diet and tobacco smoking, and air pollution is now recognized as the single biggest environmental threat to human health” (World Health Organization 2021b). The WHO set interim targets and air quality guidelines for a variety of pollutants including PM 2.5 (World Health Organization 2021a) that policymakers can use to take a phased approach to improving air quality. According to research from EIT Urban Mobility non-exhaust emissions (NEEs) - particles from brake, tyre and road wear – are now a dominant source of urban particulate matter (PM) in Europe (EIT Urban Mobility, in collaboration with Transport for London (TfL) and the Greater London Authority (GLA) and conducted by e:misia n.d.). And finally, the Euro 7 emissions standard - which specifies rules for road vehicle emissions limits - will come into effect in a phased manner from November 2026 onwards. Euro 7 includes limits on emissions from brake wear and tyre wear: key sources of PM 2.5 (European Council 2024).
Why focus on Tower Hamlets and Hackney?
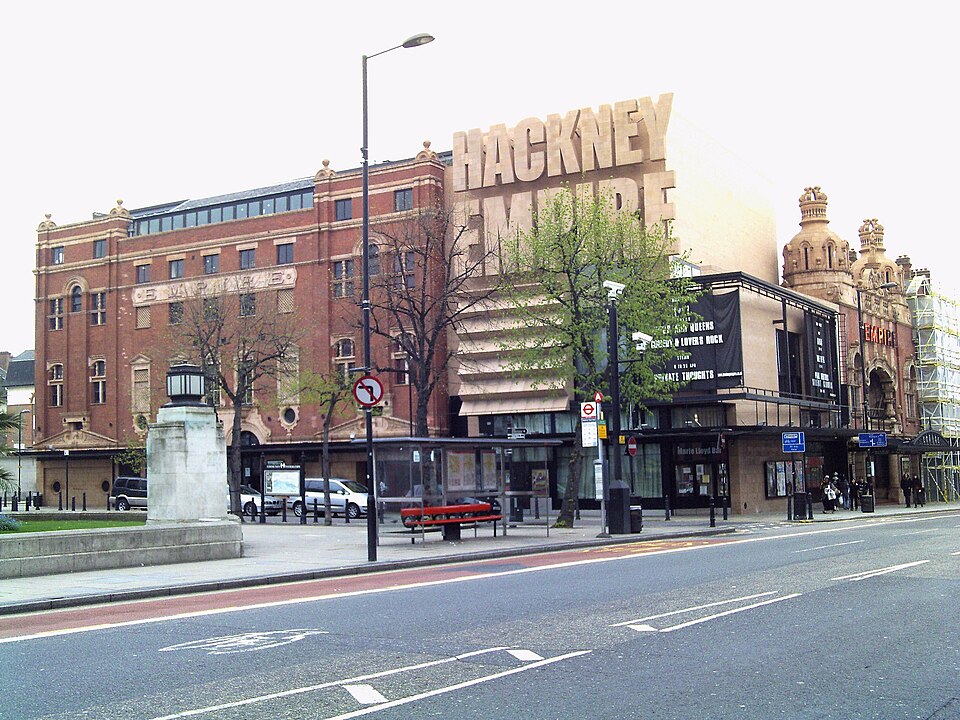
Hackney Empire: an example of the cultural richness of east London
Credit: cjc13
Source: Wikimedia Commons
Tower Hamlets and Hackney are iconic boroughs of east London: rich in culture and heritage as well as a growing hub for the technology industry. However, against this backdrop of cultural and intellectual capital Tower Hamlets and Hackney are also the two most deprived boroughs regarding income deprivation among children (Ministry of Housing, Communities & Local Government 2025). Therefore, targeting air quality improvement efforts at these two London boroughs aligns with the Mayor’s aim “for the capital to have the best air quality of any major world city, going beyond the legal requirements to protect human health and minimise inequalities” (Greater London Authority 2024).
Data analysis steps
This analysis uses the following techniques:
- data manipulation in Pandas,
- spatial joins in GeoPandas,
- basic data visualisation in Matplotlib and Seaborn, and
- interative map visualisation in Folium.
While no prior knowledge of geospatial analysis is required to understand this section of the report, interested readers may wish to familiarise themselves with fundamental concepts of geospatial analysis including coordinate reference systems (CRS), EPSG codes and the well-known text (WKT) format.
Source code can be found at https://github.com/andrewsivanesan/London-air-quality.
Import modules
Read in LAEI 2019 grid square shapefile
We begin by reading the grid squares for Tower Hamlets and Hackney into a GeoPandas DataFrame. These grid squares are 1 km x 1 km and defined using the British National Grid (BNG) coordinate reference system. Coordinates are expressed as eastings and northings. The 1km2_IDs - which are unique to each grid square - increase from west and east and from north to south.
The area covered by the London Atmospheric Emissions Inventory (LAEI) includes Greater London (the 32 London boroughs and the City of London) as well as areas outside Greater London up to the M25 motorway. (Greater London Authority 2022)
The columns that are relevant to this analysis are as follows:
- 1km_ID,
- Easting,
- Northing,
- Borough and
- geometry.
fname_grid = "LAEI2019_grid.shp"grid = gpd.read_file(fname_grid)
grid = grid[grid["Borough"].isin(["Tower Hamlets", "Hackney"])]
grid.head()| Grid_ID_19 | GridIdEx | 1km2_ID | Easting | Northing | Area_km2 | Borough | Zone | geometry | |
|---|---|---|---|---|---|---|---|---|---|
| 2764 | 2765 | 692 | 8513 | 533500 | 188500 | 0.06 | Hackney | InnerULEX | MULTIPOLYGON (((534000.003 188000.005, 533419.... |
| 2779 | 2780 | 732 | 8855 | 531500 | 186500 | 0.21 | Hackney | InnerULEX | POLYGON ((531999.998 186401.602, 531901.503 18... |
| 2782 | 2783 | 735 | 8857 | 533500 | 186500 | 1.00 | Hackney | InnerULEX | POLYGON ((534000.003 185999.997, 533000.001 18... |
| 2783 | 2784 | 736 | 8859 | 535500 | 186500 | 0.77 | Hackney | InnerULEX | POLYGON ((535999.999 186554.499, 535999.999 18... |
| 2786 | 2787 | 739 | 8861 | 537500 | 186500 | 0.04 | Hackney | InnerULEX | POLYGON ((537306.404 185999.997, 537000.001 18... |
Note that each 1km2_ID can contain multiple geometries from multiple boroughs. This typically occurs at the boundary between boroughs. Therefore, there can be more than one row per 1km2_ID. An illustrative example is 1km2_ID 9545, which lies on the boundary between Tower Hamlets and Hackney (see plot below).
grid[grid["1km2_ID"] == 9545].plot(column="Borough", legend=True)
plt.title("One LAEI grid square can contain multiple polygons")
plt.xlabel("Easting")
plt.ylabel("Northing")
plt.show()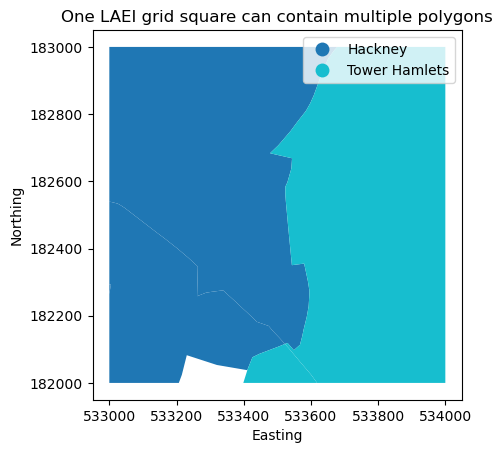
Read in PM 2.5 annual average concentrations data
Next, we read in the PM 2.5 annual average concentrations data. Please note that this data is high-resolution: one data point per 20 metre x 20 metre square. There are around 6 million rows of data in the original dataset (which covers the whole of London). This exceeds the 100 MB file size limit in GitHub. Therefore, the data was split (outside of this notebook) into smaller chunks that could be uploaded to GitHub.
The data is filtered using a rough easting-northing box covering Tower Hamlets and Hackney. Note that this dataset only contains eastings, northings and average annual PM 2.5 concentrations (measured in µg/m3).
chunks = range(1, 12)

# Define a rough easting and northing box for Tower Hamlets and Hackney
min_easting = 530000
max_easting = 540000
min_northing = 178000
max_northing = 188000

# read in first chunk
df = pd.read_csv("LAEI2022_V1_PM25_chunk_0.csv").rename(columns={"x": "Easting", "y": "Northing"})

# append remaining chunks
for c in chunks:
    add_df = pd.read_csv(f"LAEI2022_V1_PM25_chunk_{c}.csv").rename(columns={"x": "Easting", "y": "Northing"})
    df = pd.concat([df, add_df])

# define filter condition for the easting and northing box
cond = (df["Easting"].between(min_easting, max_easting)) & (df["Northing"].between(min_northing, max_northing))

df = df[cond]

df.head()| Easting | Northing | conc | |
|---|---|---|---|
| 195398 | 530000 | 188000 | 9.581474 |
| 195399 | 530020 | 188000 | 9.411696 |
| 195400 | 530040 | 188000 | 9.351303 |
| 195401 | 530060 | 188000 | 9.332762 |
| 195402 | 530080 | 188000 | 9.329437 |
Perform spatial join
We need to map the concentrations data to LAEI 2019 grid squares. To do this, we convert the PM2 2.5 concentrations data from a Pandas DataFrame to a GeoPandas DataFrame. This will create a Point object for each data point. This enables us to perform a spatial join between the LAEI 2019 grid squares and the PM 2.5 concentrations data. As mentioned previously: the coordinate reference system is British National Grid. This is expressed via the EPSG code 27700. The spatial join maps each PM 2.5 concentration data point to a LAEI 2019 grid square and, by extension, a London borough.
gdf = gpd.GeoDataFrame(df,
                       geometry=gpd.points_from_xy(df["Easting"], df["Northing"]),
                       crs="EPSG:27700")

gdf.head()| Easting | Northing | conc | geometry | |
|---|---|---|---|---|
| 195398 | 530000 | 188000 | 9.581474 | POINT (530000 188000) |
| 195399 | 530020 | 188000 | 9.411696 | POINT (530020 188000) |
| 195400 | 530040 | 188000 | 9.351303 | POINT (530040 188000) |
| 195401 | 530060 | 188000 | 9.332762 | POINT (530060 188000) |
| 195402 | 530080 | 188000 | 9.329437 | POINT (530080 188000) |
grid_contains_points = grid.sjoin(gdf, how="inner", predicate="contains")

grid_contains_points.head()| Grid_ID_19 | GridIdEx | 1km2_ID | Easting_left | Northing_left | Area_km2 | Borough | Zone | geometry | index_right | Easting_right | Northing_right | conc | |
|---|---|---|---|---|---|---|---|---|---|---|---|---|---|
| 2779 | 2780 | 732 | 8855 | 531500 | 186500 | 0.21 | Hackney | InnerULEX | POLYGON ((531999.998 186401.602, 531901.503 18... | 433840 | 531900 | 186380 | 11.285640 |
| 2779 | 2780 | 732 | 8855 | 531500 | 186500 | 0.21 | Hackney | InnerULEX | POLYGON ((531999.998 186401.602, 531901.503 18... | 433841 | 531920 | 186380 | 10.262810 |
| 2779 | 2780 | 732 | 8855 | 531500 | 186500 | 0.21 | Hackney | InnerULEX | POLYGON ((531999.998 186401.602, 531901.503 18... | 430853 | 531880 | 186400 | 11.863350 |
| 2779 | 2780 | 732 | 8855 | 531500 | 186500 | 0.21 | Hackney | InnerULEX | POLYGON ((531999.998 186401.602, 531901.503 18... | 430855 | 531920 | 186400 | 9.997118 |
| 2779 | 2780 | 732 | 8855 | 531500 | 186500 | 0.21 | Hackney | InnerULEX | POLYGON ((531999.998 186401.602, 531901.503 18... | 430854 | 531900 | 186400 | 10.211490 |
Calculate median PM 2.5 concentrations for each LAEI 2019 grid square
Due to the high-resolution of the PM 2.5 concentrations data we now have multiple concentrations data points mapped to each grid square. To produce a high-level visualisation for each LAEI 2019 grid square we need to summarise the PM 2.5 concentrations for each LAEI 2019 grid square. The median (middle) value provides a representative PM 2.5 concentration for each LAEI 2019 grid square that isn’t skewed by the distribution of concentrations (including outliers).
A box plot of the median PM 2.5 concentrations provides intuition regarding the distribution of median PM 2.5 concentrations.
# This cell is split into multiple lines of code purely for the benefit of readability
median_conc_per_grid_square = gpd.GeoDataFrame(grid_contains_points.groupby(["1km2_ID", "geometry", "Borough"])["conc"].median().reset_index())
median_conc_per_grid_square = median_conc_per_grid_square.rename(columns={"conc": "Median_PM2.5_concentration"})
median_conc_per_grid_square["Median_PM2.5_concentration"] = round(median_conc_per_grid_square["Median_PM2.5_concentration"], 2)
#median_conc_per_grid_square.head()
# Median PM 2.5 concentrations are symmetrical: centred on 9.8 micrograms per cubic metre
# PM 2.5 concentrations straddle interim target 4 (10 micrograms per cubic metre) and interim target 3 (15 grams per cubic metre)
sns.boxplot(data=median_conc_per_grid_square, x="Median_PM2.5_concentration")
plt.xlabel("Median PM 2.5 concentration (micrograms/cubic metre)")
plt.show()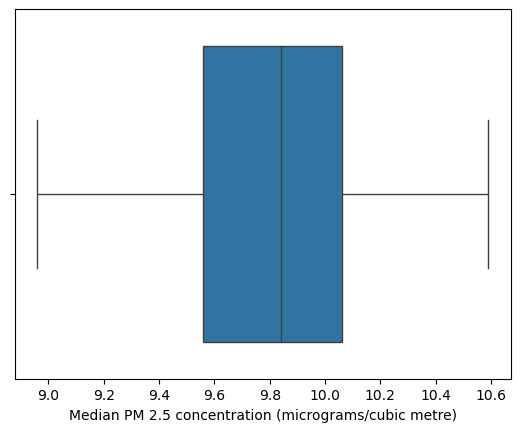
Categorise each grid square relative to the WHO 2021 interim targets and air quality guideline (AQG)
We now compare the PM 2.5 concentrations for each LAEI 2019 grid square against the interim targets and air quality guideline from the World Health Organizaton.
The WHO_guideline_categoriser function will be used to produce values in the tooltip in the interactive choropleth map at the end of this notebook.
The WHO_target_value function will be used to colour the LAEI 2019 grid squares in the interative choropleth map at the end of this notebook.
A summary count is performed to gauge how many grid squares are mapped to each interim target or air quality guideline.
def WHO_guideline_categoriser(conc):
    """
    This function categorises whether an annual average
    PM 2.5 concentration meets the four interim targets or
    the air quality guideline (AQG) level set by the World
    Health Organisation in 2021.

    Parameters:

    conc (float): Annual average PM 2.5 concentration in micrograms per cubic metre.

    Returns:

    out (str): String indicating which PM 2.5 annual average concentration target has been met.

    """
    if conc < 5:
        out = "AQG guideline (5 micrograms per cubic metre)"
    elif 5 <= conc < 10:
        out = "Interim target 4 (10 micrograms per cubic metre)."
    elif 10 <= conc < 15:
        out = "Interim target 3 (15 micrograms per cubic metre)."
    elif 15 <= conc < 25:
        out = "Interim target 2 (25 micrograms per cubic metre)."
    elif 25 <= conc < 35:
        out = "Interim target 1 (35 micrograms per cubic metre)."
    elif conc >= 35:
        out = "Not achieving interim targets."

    return out
def WHO_target_value(conc):
"""
This function categorises whether an annual average
PM 2.5 concentration meets the four interim targets or
the air quality guideline (AQG) level set by the World
Health Organisation in 2021.
Parameters:
conc (float): Annual average PM 2.5 concentration in micrograms per cubic metre.
Returns:
out (str): Integer indicating which PM 2.5 annual average concentration target has been met.
"""
if conc < 5:
out = None
elif 5 <= conc < 10:
out = 4
elif 10 <= conc < 15:
out = 3
elif 15 <= conc < 25:
out = 2
elif 25 <= conc < 35:
out = 1
elif conc >= 35:
out = None
return outmedian_conc_per_grid_square["Target"] = median_conc_per_grid_square.apply(lambda x: WHO_guideline_categoriser(x["Median_PM2.5_concentration"]), axis=1)
median_conc_per_grid_square["TargetValue"] = median_conc_per_grid_square.apply(lambda x: WHO_target_value(x["Median_PM2.5_concentration"]), axis=1)# 53 out of 73 grid squares in Tower Hamlets and Hackney meet interim target 4 (10 micrograms per cubic metre)
# All grid squares in Tower Hamlets and Hackney meet either interim target 4 (10 micrograms per cubic metre) or interim target 3 (15 micrograms per cubic metre)
median_conc_per_grid_square.groupby("Target").count()| 1km2_ID | geometry | Borough | Median_PM2.5_concentration | TargetValue | |
|---|---|---|---|---|---|
| Target | |||||
| Interim target 3 (15 micrograms per cubic metre). | 20 | 20 | 20 | 20 | 20 |
| Interim target 4 (10 micrograms per cubic metre). | 53 | 53 | 53 | 53 | 53 |
median_conc_per_grid_square.groupby("TargetValue").count()| 1km2_ID | geometry | Borough | Median_PM2.5_concentration | Target | |
|---|---|---|---|---|---|
| TargetValue | |||||
| 3 | 20 | 20 | 20 | 20 | 20 |
| 4 | 53 | 53 | 53 | 53 | 53 |
Visualise the median PM 2.5 concentrations on an interactive choropleth map
Finally, we visualise the median PM 2.5 concentrations on a choropleth map. This provides an interactive and intuitive way for non-technical readers to engage with the data.
The choropleth map reveals a hotspot (blue squares) in the south-west of Hackney and north-west of Tower Hamlets. Visual inspection reveals that this hotspot spans the five districts of Shoreditch, Whitechapel, Hoxton, Haggerston and Bethnal Green. They are achieving interim target 3 (10 to 15 μg/m3) whereas the rest of Tower Hamlets and Hackney are achieving interim target 4 (5 to 10 μg/m3) (yellow squares). Hover your cursor over each square to get additional information via the tooltip.
As mentioned previously: please note that some grid squares (e.g. at the boundary between Tower Hamlets and Hackney) contain more than one polygon.
How this visualisation handles grid squares containing multiple polygons
Where an LAEI 2019 grid square contains multiple polygons the colour of the grid square is based on the polygon with the highest median annual average concentration of PM 2.5. This is true even if the polygon constitutes a very small portion of the grid square. An example is the south-east corner of 1km2_ID 9373 (between Haggerston and Hoxton on the Tower Hamlets/Hackney border). Therefore, in the case of grid squares containing multiple polgyons: the map visualises the “worst-case” median annual average PM 2.5 concentration.
london_centre = [51.51, -0.12]

# these two functions will be used in the tooltip
style_function = lambda x: {'fillColor': '#ffffff',
                            'color':'#000000',
                            'fillOpacity': 0.1,
                            'weight': 0.1}

highlight_function = lambda x: {'fillColor': '#000000',
                                'color':'#000000',
                                'fillOpacity': 0.50,
                                'weight': 0.1}

m = folium.Map(location=london_centre, zoom_start=11)

folium.Choropleth(
    geo_data=median_conc_per_grid_square,
    name="Median PM 2.5 concentrations",
    data=median_conc_per_grid_square,
    #columns=["1km2_ID", "Median_PM2.5_concentration"],
    columns=["1km2_ID", "TargetValue"],
    key_on="feature.properties.1km2_ID",
    fill_color="plasma",
    legend_name="WHO interim target").add_to(m)

folium.LayerControl().add_to(m)

tooltip = folium.features.GeoJson(median_conc_per_grid_square,
                                  style_function=style_function,
                                  control=False,
                                  highlight_function=highlight_function,
                                  tooltip=folium.features.GeoJsonTooltip(
                                      fields=["Borough", "1km2_ID", "Median_PM2.5_concentration", "Target"],
                                      style=("background-color: white; color: #333333; font-family: arial; font-size: 12px; padding: 10px;")
                                  )
                                 )
m.add_child(tooltip)

m
Make this Notebook Trusted to load map: File -> Trust Notebook
Conclusion
Analysis of the most recent data from the London Atmospheric Emissions Inventory (LAEI 2022) shows that Shoreditch, Whitechapel, Hoxton, Haggerston and Bethnal Green have the highest annual average concentrations of particulate matter (PM 2.5) in Tower Hamlets and Hackney - two of the most deprived boroughs in London (Ministry of Housing, Communities & Local Government 2025). While these five districts are achieving the World Health Organisation’s (WHO) third interim target of between 10 and 15 μg/m3 (World Health Organization 2021a), they are within 1 μg/m3 of achieving the fourth interim target of between 5 and 10 μg/m3. For context: the fourth interim target is being achieved by the rest of Tower Hamlets and Hackney. Achieving interim target 3 is an important step towards achieving the World Health Organisation’s Air Quality Guideline of less than 5 μg/m3 of annual average PM 2.5 concentrations, which minimises negative health impacts.
Policymakers may wish to consider a public awareness campaign in the heart of east London reminding local residents of the London Assembly’s recommendations for improving air quality (London Assembly n.d.). Their recommendations are listed below for ease of reference.
- Walk, cycle and scoot more, and avoid the busiest roads and times when you can
- Use public transport where you can, but if you do have to drive, switch your engine off when you’re stationary.
Any air quality improvement activities in these districts would be best done in partnership with community-led initiatives such as Breathe London Communities (Breathe London Communities n.d.) to ensure the activities are relevant to, and have buy-in from, local residents.
References
Breathe London Communities. n.d. “About the Breathe London Communities Network.” Accessed February 23, 2026. https://www.breathelondon-communities.org/about.
Department for Environment, Food & Rural Affairs. 2025. “Particulate Matter (PM10/PM2.5).” 2025. https://www.gov.uk/government/statistics/air-quality-statistics/concentrations-of-particulate-matter-pm10-and-pm25.
EIT Urban Mobility, in collaboration with Transport for London (TfL) and the Greater London Authority (GLA) and conducted by e:misia. n.d. “Study on Non-Exhaust Emissions (NEE) in Road Transport.” Accessed February 23, 2026. https://www.eiturbanmobility.eu/knowledge-hub/non-exhaust-emission-study/?utm_source=linkedin&utm_medium=organic&utm_campaign=promotion_2205.
European Council. 2024. “Euro 7: Council Adopts New Rules on Emission Limits for Cars, Vans and Trucks.” 2024. https://www.consilium.europa.eu/en/press/press-releases/2024/04/12/euro-7-council-adopts-new-rules-on-emission-limits-for-cars-vans-and-trucks/.
Greater London Authority. 2022. “London Atmospheric Emissions Inventory LAEI 2022.” 2022. https://data.london.gov.uk/dataset/london-atmospheric-emissions-inventory-laei-2022-2lg5g/.
———. 2024. “London Environment Strategy: Fourth Progress Report (2018-2024).” 2024. https://www.london.gov.uk/sites/default/files/2024-03/LES_4%20Progress%20Report.pdf.
London Assembly. n.d. “Monitoring and Predicting Air Pollution.” Accessed February 23, 2026. https://www.london.gov.uk/programmes-and-strategies/environment-and-climate-change/pollution-and-air-quality/monitoring-and-predicting-air-pollution.
Ministry of Housing, Communities & Local Government. 2025. “English Indices of Deprivation 2025: Statistical Release.” 2025. https://www.gov.uk/government/statistics/english-indices-of-deprivation-2025/english-indices-of-deprivation-2025-statistical-release.
World Health Organization. 2021b. “WHO Global Air Quality Guidelines. Particulate Matter (PM2.5 and PM10), Ozone, Nitrogen Dioxide, Sulfur Dioxide and Carbon Monoxide. Licence: CC BY-NC-SA 3.0 IGO.” xiv. https://iris.who.int/server/api/core/bitstreams/551b515e-2a32-4e1a-a58c-cdaecd395b19/content.
———. 2021a. “WHO Global Air Quality Guidelines. Particulate Matter (PM2.5 and PM10), Ozone, Nitrogen Dioxide, Sulfur Dioxide and Carbon Monoxide. Licence: CC BY-NC-SA 3.0 IGO.” xvii. https://iris.who.int/server/api/core/bitstreams/551b515e-2a32-4e1a-a58c-cdaecd395b19/content.